Selected work
SQL, statistics, ML — and a shipped AI SaaS.
Every project runs on real data and ends in a decision: revenue at risk, a lift, a segment to target, a forecast to act on.
01 · Founder — shipped SaaSLive
BizFalcon AI
A SaaS company I founded and built solo, end to end: React + TypeScript frontends, a Firebase backend (Auth, Firestore, Cloud Functions), Stripe billing, CI, and production deploys. The flagship, BizFalcon Analyst, is an AI business analyst that writes and runs Python on your full dataset in the browser — every number computed, never estimated, with the formula behind each figure one click away. The same engine ships as ProfitFalcon (e-commerce unit economics) and ClientFalcon (a strategist on every agency client account), plus Fledge for creator analytics. On top sits an agentic layer: deterministic AI playbooks that watch business data, recommend the exact next move with projected $ impact, wait for human approval, then score every decision against what actually happened in a ledger. The direction — turn hours of manual analysis into reviewed, one-click actions, cutting the analyst bottleneck for teams too lean to hire one.
Founded & shipped solo
Agentic playbooks · human-approved
Decision→outcome ledger
1,800+ tests · CI
React · TypeScript · Firebase · Pyodide · OpenAI / Anthropic / Gemini · Stripe
02 · Customer analyticsSegmentation
Retail Customer Intelligence
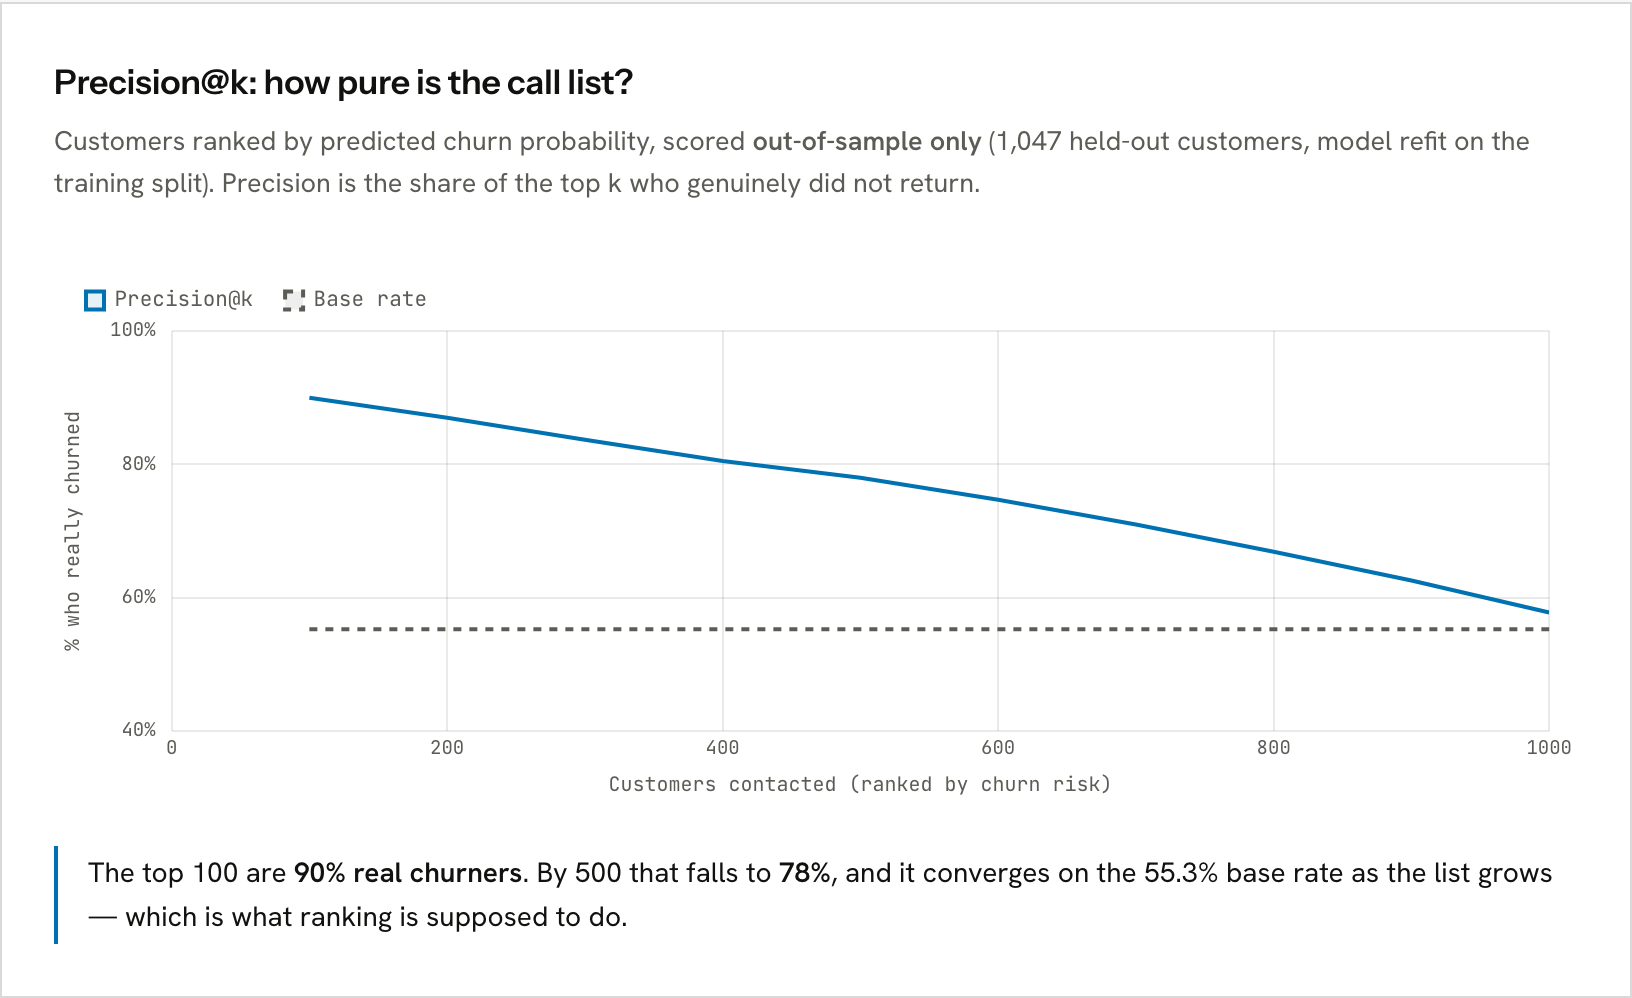
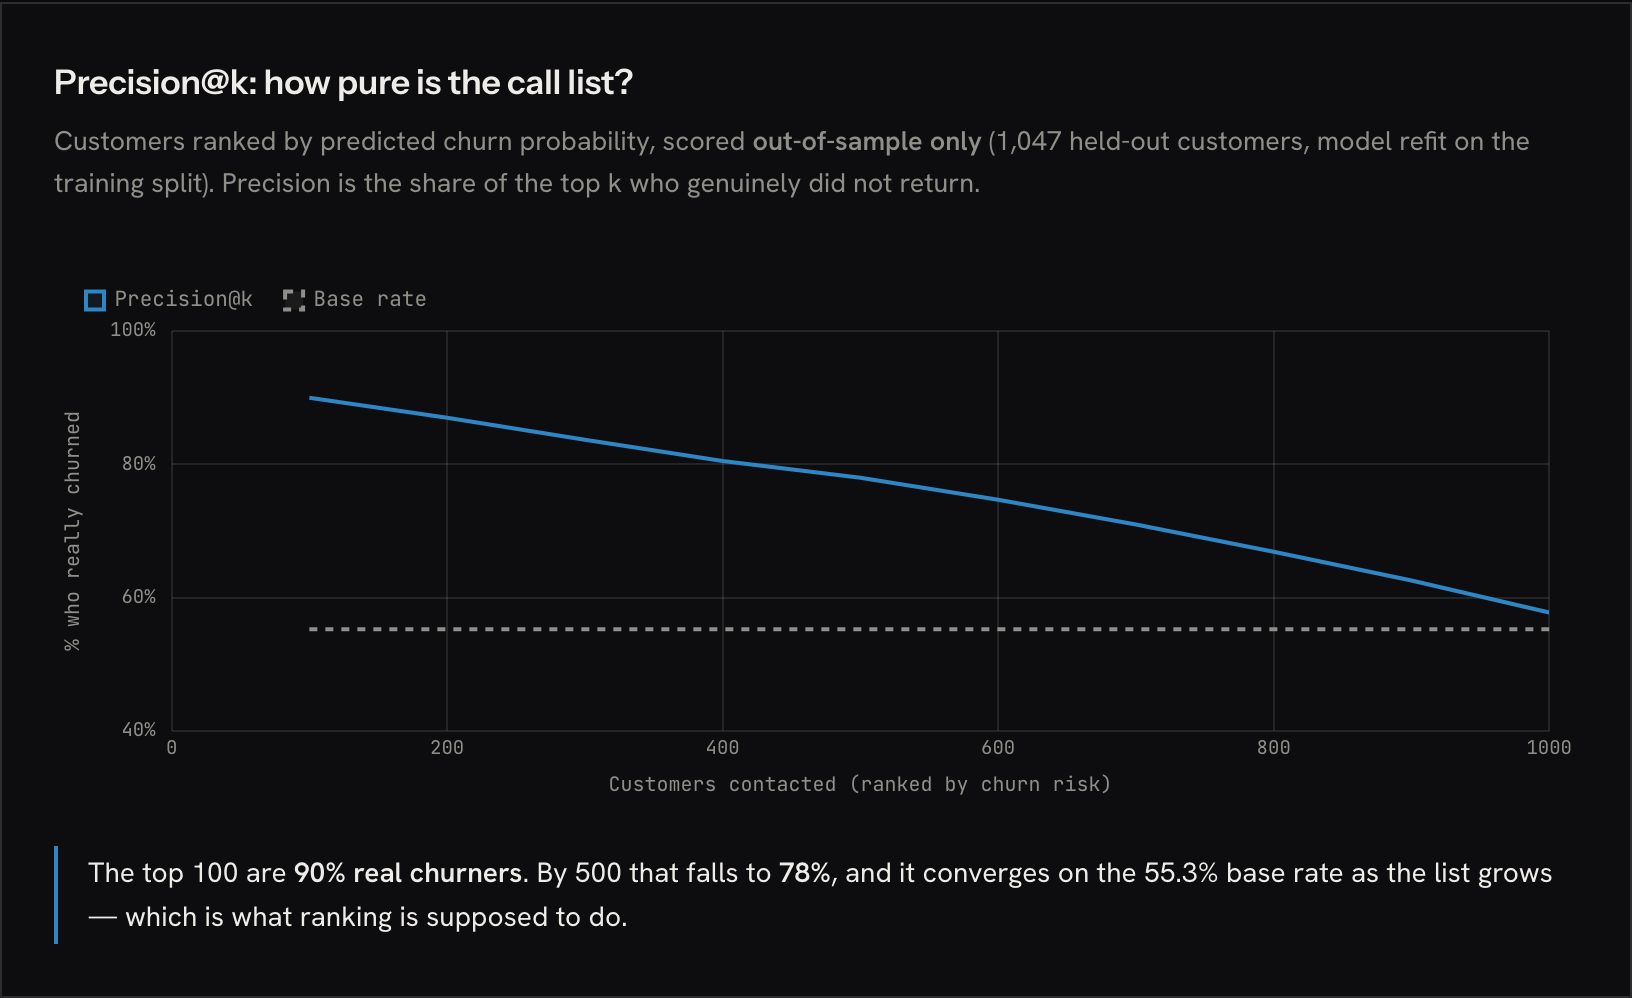
Customer analytics on 802,712 real transactions (41 countries, £17.45M). K-means RFM segmentation into 4 tiers; a churn model scored out-of-sample at 0.796 ROC-AUC against a 55.3% base rate. The retention call list is sized with a precision@k curve — top 100 are 90% real churners — and a cost model that shows capacity, not contact cost, is the binding constraint. Apriori rules lift 24×.
Precision@k on 1,047 held-out customers · top 100 are 90% churners
Python · Scikit-learn · Pandas · RFM
03 · SQLBusiness intelligence
Olist E-Commerce Analysis
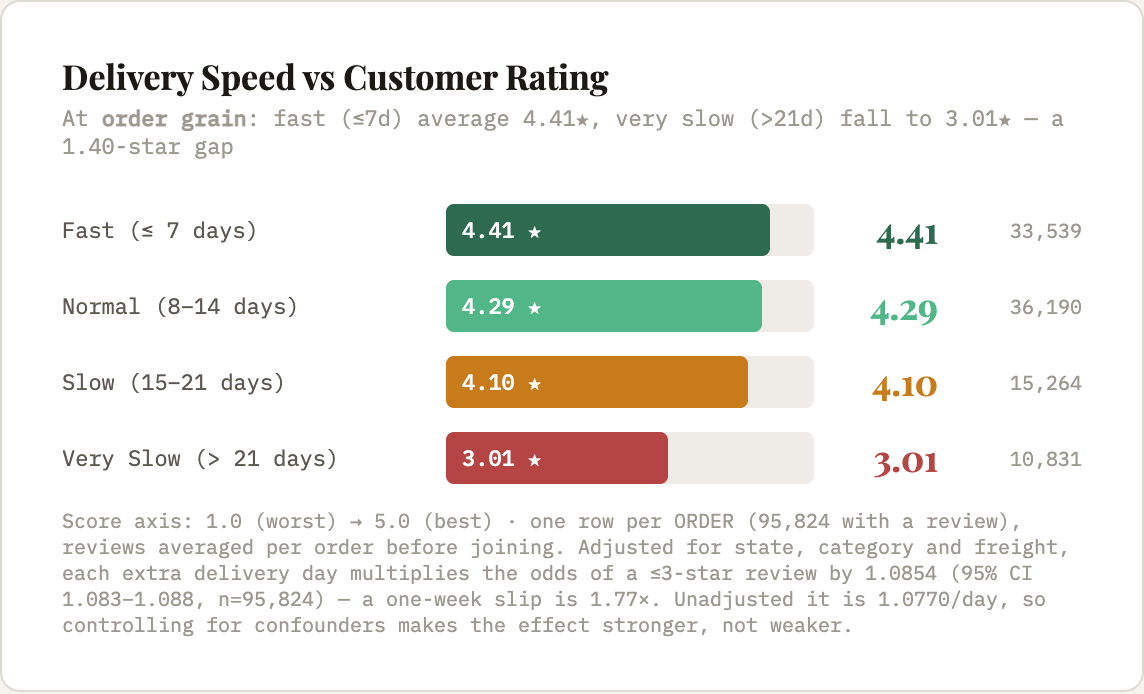
End-to-end BI on 96,478 real Brazilian e-commerce orders — 9 source tables joined into a star-schema flat table, then analysed in SQLite with CTEs and window functions. Health & Beauty leads at R$1.4M of R$15.4M; at order grain, deliveries past 21 days average 3.01★ against 4.41★ for sub-7-day ones. A logistic regression controlling for state, category and freight puts a one-week delivery slip at 1.78× the odds of a ≤3-star review (OR 1.085/day, CI 1.083–1.088, n=95,824) — the adjusted effect is stronger than the raw one, so confounders were masking it. Published as a live Tableau dashboard.
Delivery speed vs rating, order grain · 4.41★ → 3.01★
SQL · Python · Tableau · Pandas · Excel
04 · Predictive MLCalibrated
NBA Game Outcome Model
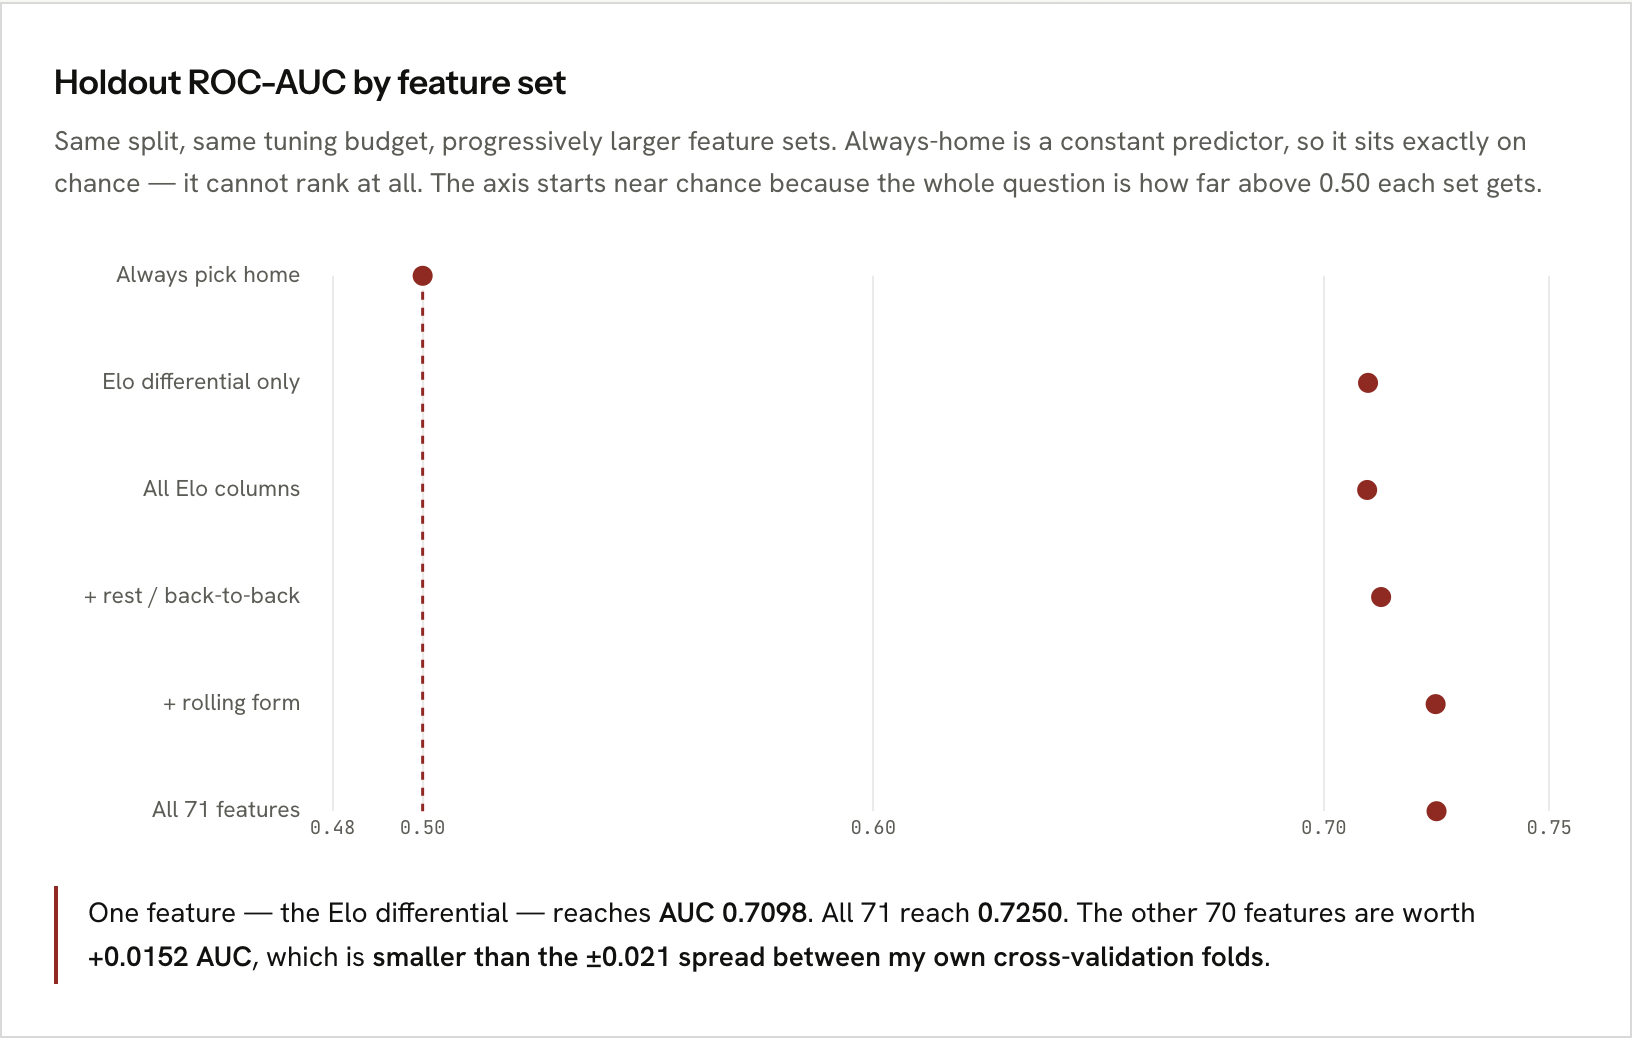
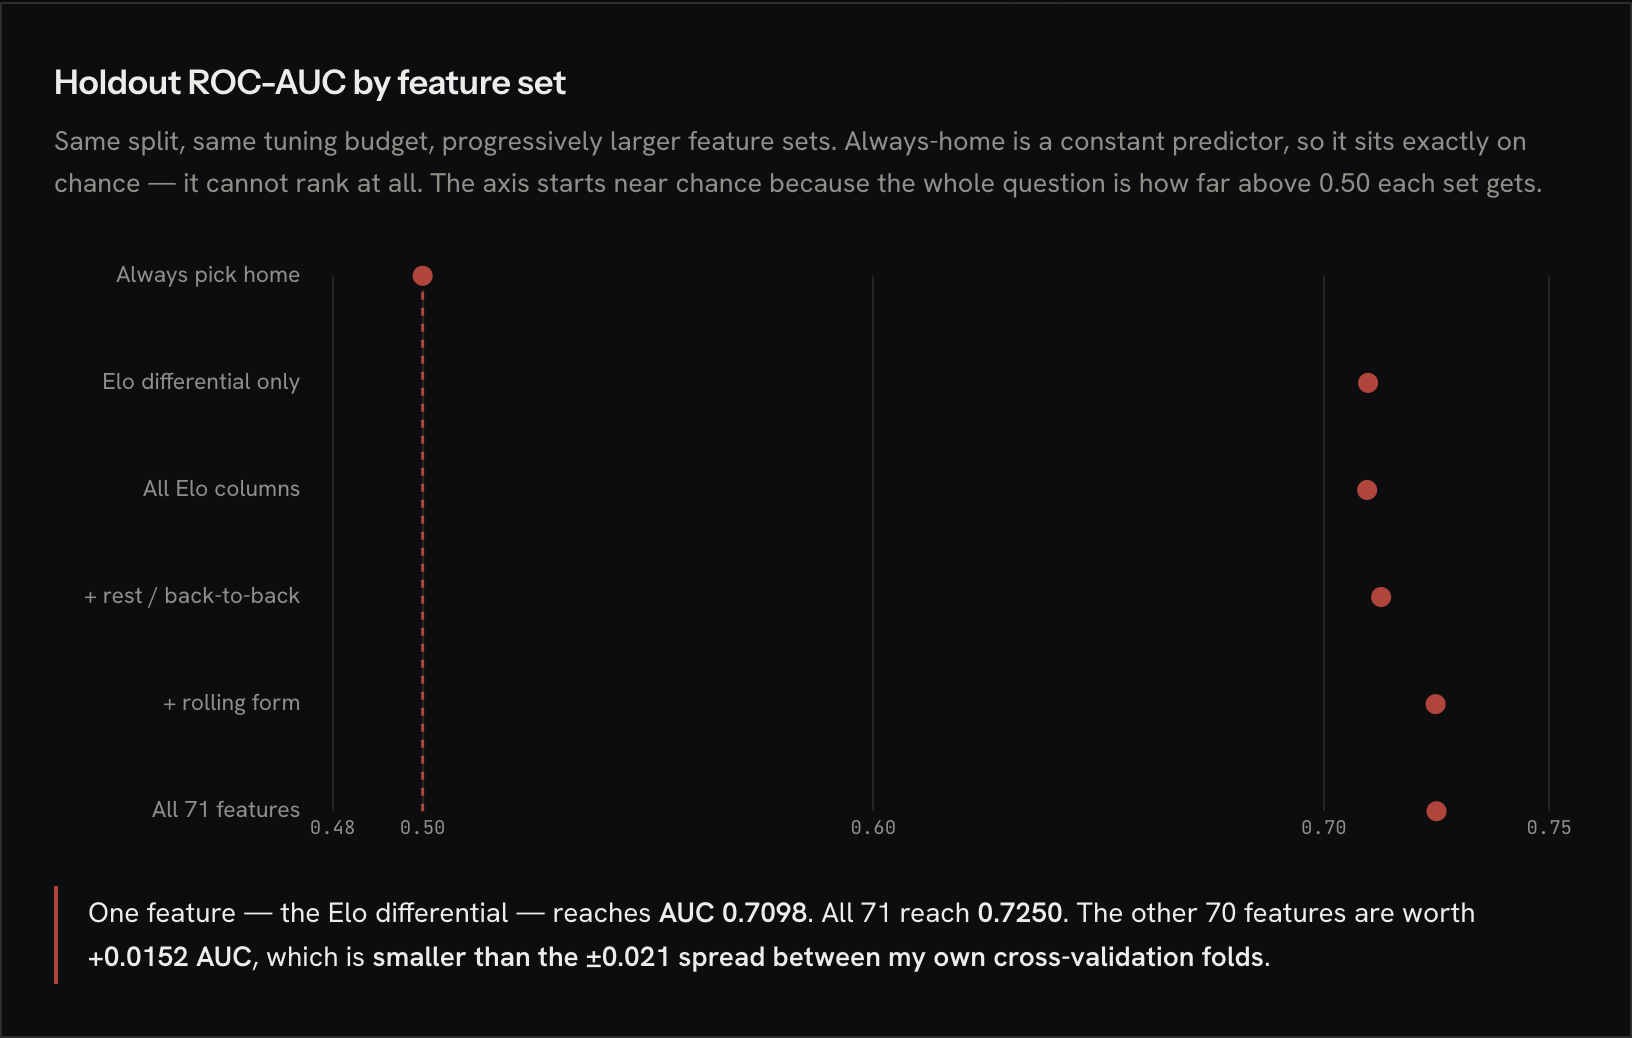
A gradient-boosted classifier on 10,624 real games (9 seasons, nba_api). Held out the entire unseen 2024-25 season: 66.4% accuracy vs a 54.4% always-home baseline, AUC 0.727, isotonic-calibrated. Then I ablated the feature set — Elo differential alone reaches AUC 0.710, so the other 70 features are worth +0.015, inside my own CV noise. A second check on the complete 2025-26 season — 1,230 games that postdate every design choice here — holds at AUC 0.718, and shows the booster does not out-rank the closed-form Elo formula (0.718 vs 0.718); what it earns is calibration, Brier 0.212 vs 0.215. That check is Elo-only: 2025-26 box scores are not obtainable, so scores come from Basketball-Reference. Bubble games are down-weighted; home advantage measurably collapsed in 2020.
Holdout AUC by feature set · Elo alone 0.7098 vs 0.7250
Python · HistGradientBoosting · Optuna · SQLite
05 · Data vizWebGL
Cosmos Deep Field
An interactive 3D map where every point is a real object someone measured — 10,202,358 in the catalogue: 6,786,069 Gaia DR3 stars, 2,656,968 SDSS and 2MRS galaxies, 752,910 SDSS quasars and 6,411 NASA exoplanet host stars, plus the cosmic web as 260,178 filament segments (Tempel et al. 2014). Nothing is generated or decorative. Five sky-survey APIs feed a Python pipeline; Astropy turns parallax or redshift into 3D positions. Each point is quantized to 8 bytes and streamed through an octree LOD drawing about 1.8M per frame. Layers sit on their own shells, so distances between them are presentational. The public build streams 4,616,289 of those points — the full 6.79M Gaia tier is a 54 MB file that is not committed, so the viewer ships a 1.2M-star tier in its place. Fly it with WASD.
6,786,069 stars · 2,656,968 galaxies · 752,910 quasars · 6,411 exo hosts · +260,178 filament segments · 10,202,358 measured · 4,616,289 served
Python · Astropy · Three.js · Pandas